Seasonal Trip Table
Overview
Replica runs a seasonal, high-fidelity simulation that accurately represents the population and its travel patterns for the whole country. Customers use this data to improve planning and monitoring of transportation and land use systems, and to make decisions related to the ways people interact with the built environment.
Replica seasonal trip tables are the world’s only calibrated travel demand model delivered at nationwide scale offered via software-as-a-service (SaaS). It is delivered in a pioneering privacy-sensitive approach.
The dataset is a complete trip table (see schema below) and population table (see schema for Demographics & Employment table) for a typical weekday and typical weekend day for the selected season and region. It is accessible through Replica’s web-based platform and through direct database access.
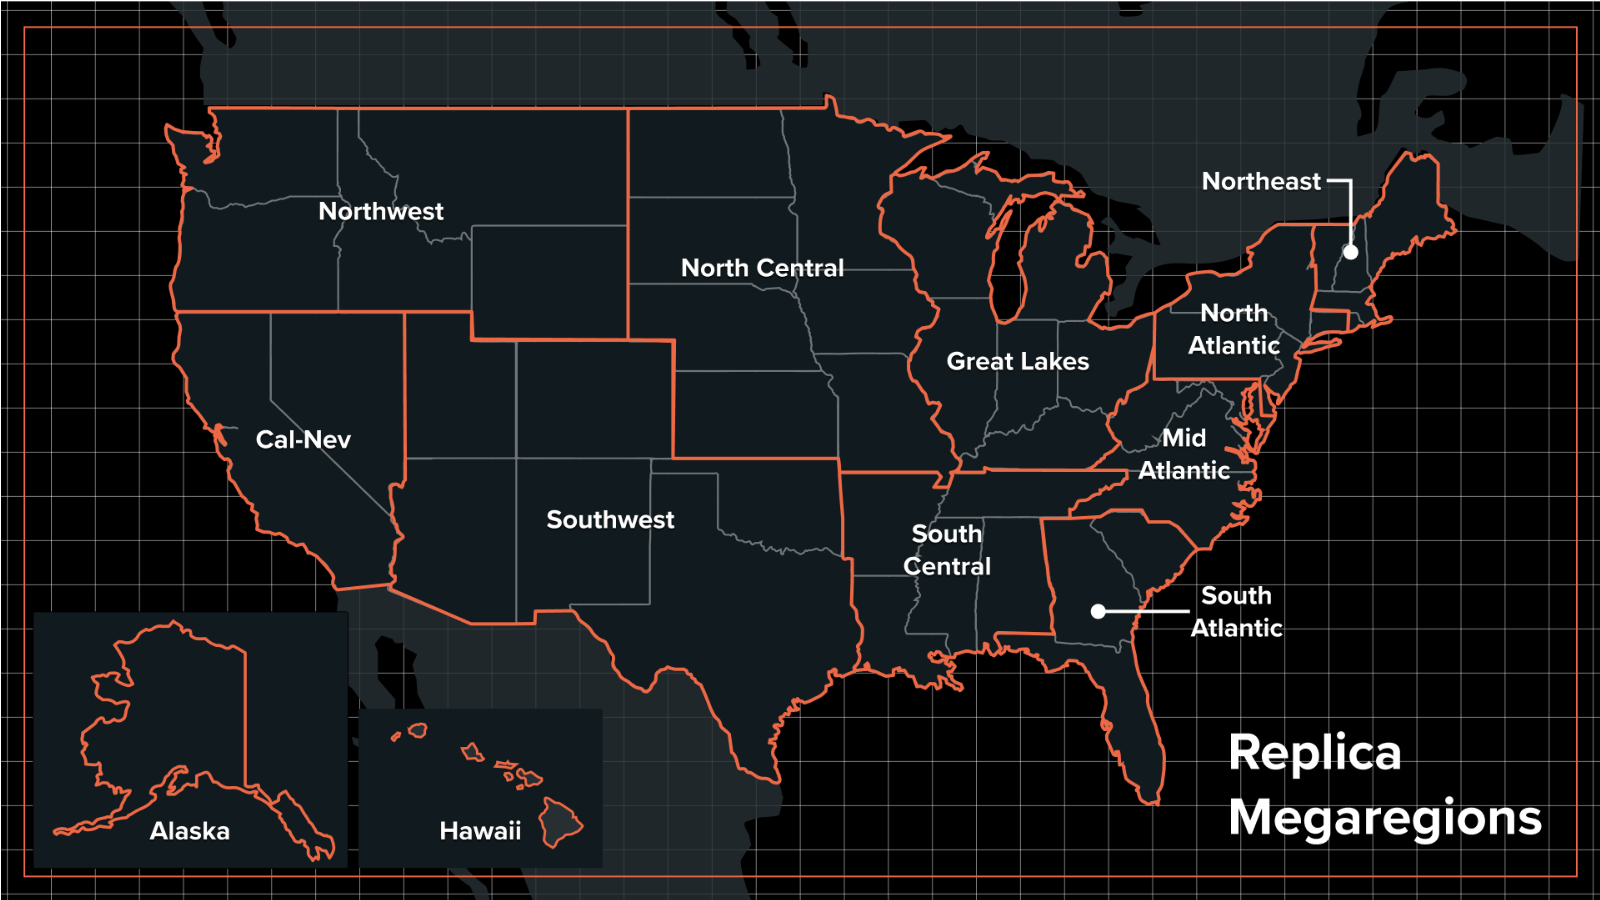
Replica trip tables data is broken out geographically into megaregions which include between 10 million and 50 million residents. Each data table is cross-tabular, meaning it is linked to other tables through common IDs, including person_id (the person making the trip), activity_id (the trip), or route_id (transit routes or network links used for a trip).
Data can be filtered on any single attribute or combination of attributes. Each row of data in the simulation output reflects a single trip, with characteristics about the trip (e.g., origin, destination, mode, purpose, routing, duration) and trip taker (e.g., age, race/ethnicity, income, home location, work/school location).
The trip table contains the unique records and associated attributes for the trips between origin and destination points. Trip data represents the modeled output for a typical Thursday or Saturday during each season. Each row of data represent one trip. Data is released twice a year and is currently available for 2019, 2021 and 2022. It is available for download in CSV format.
The trip table can be purchased as is with all modes or can be broken down by mode allowing you to buy specific trip data about the modes you are interested in. The mode-specific trip tables tables are detailed in the following sections: Auto & TNC Trips, Transit Trips, Active Transportation Trips, Commercial Freight Trips.
Sample Download
Click here to download a sample of Replica's seasonal trip table.
Schema
| Field Name | Content Type | Sample Value | Description |
|---|---|---|---|
| activity_id | String | 12456839588397874772 | A randomly assigned unique identifier defined for each trip. A trip is defined as travel between two locations with a discrete purpose at the origin and destination. Some intermediate stops with short dwell time may be captured within a single trip. Criteria for this dwell time may vary. Examples of trips: • Home > Work, • Work > Gym, • Shop > Eat, • Home > Starbucks drive-thru > Work |
| person_id | String | 5666337802154872887 | A randomly assigned unique identifier for each person modeled within the synthetic population. |
| household_id | String | 12981492413956702344 | A randomly assigned unique identifier for each household modeled within the synthetic population. |
| mode | String | PUBLIC_TRANSIT | The primary transportation mode used for the trip. A trip is often made up of multiple travel modes, such as a journey to work that includes a walk to a rail station followed by a subway ride. In this case two modes were used by the traveler during their trip, walking and public transit. Only the primary mode of travel across a set of trip segments is included. The primary mode is determined using the following ranking: 1) Public transit, 2) Driving (private auto)/Auto passenger/Taxi/TNC, 3) Biking, 4) Walking. Valid values are: • BIKING: Trips made by people biking. Replica does not model scooter trips and does not separate out e-bike trips • CARPOOL: Trips made by passengers in private auto vehicles. Sum Carpool and Private Auto trips to get the total number of people who traveled in private autos • COMMERCIAL: Trips made by medium and heavy trucks • ON_DEMAND_AUTO: Trips made by passengers in a Taxi or using a Transportation Network Company (TNC) such as Uber or Lyft • OTHER_TRAVEL_MODE: Catch-all category for all other trips not assigned any of the modes listed herein • PRIVATE_AUTO: Trips made by drivers in private auto vehicles • PUBLIC_TRANSIT: Trips that primarily used public transit, such as buses, light rail, and subways • WALKING: Trips made by people walking Replica does not explicitly model trips made by school buses. These trips would fall under other mode categories, like auto passengers of private auto vehicles, private auto (for those old enough to drive), or walking. |
| travel_purpose | String | WORK | The destination activity assigned to a synthetic person. For example, if a person is traveling to work, the purpose of the trip is 'Work,' whereas if a person is traveling to a restaurant the activity is 'Eat.' Valid values are: • COMMERCIAL: Trips by medium and heavy trucks for deliveries and other commercial purposes • EAT: Trips to restaurants • HOME: Trips where the destination is the person's home • LODGING: Trips by visitors to overnight accommodation such as a hotel • MAINTENANCE: Trips to hairdressers, auto shops, banks, and a variety of other locations for the purpose of conducting errands • OTHER: Catch-all category for all other trips not assigned any of the purposes listed herein • RECREATION: Trips to recreational destinations such as parks and swimming pools • REGION_DEPARTURE: Trips to a port-of-exit, such as an airport, or freeway crossing. • SCHOOL: Trips to schools such as community colleges and universities • SHOP: Trips to stores and other commercial centers • SOCIAL: Trips for social activities • STAGE: Trips made by non-residents that start and end outside the region • WORK: Trips where the destination is the person's workplace • WORK FROM HOME: Trips where a resident is returning home to work (specifically for residents who are working from home on the modeled day). For example, if a person goes out to lunch during the work day, their return trip home will be labeled “work_from_home" |
| tour_type | String | COMMUTE | Indicates what type of tour included this trip. Tours are travel events that start at one location and return to that same location. For example, when a person travels to work and returns home, it is a home-based work tour. A tour can have two or more trips. Valid values are: • WORK_BASED: Tours that started and ended at work, excluding commute e.g. Work > Eat > Work • COMMUTE: Tours from home to work and back home including intermediate stops at other destinations e.g. Home > Recreation > Work > Shop > Home • OTHER_HOME_BASED: Tours that started and ended at home, excluding commutes e.g. Home > Shop > Eat > Home |
| previous_activity_type | String | HOME | The activity assigned to a synthetic person prior to starting travel. Valid values are: • COMMERCIAL: Trips by medium and heavy trucks for deliveries and other commercial purposes • EAT: Trips to restaurants • HOME: Trips where the destination is the person's home • LODGING: Trips by visitors to overnight accommodation such as a hotel • MAINTENANCE: Trips to hairdressers, auto shops, banks, and a variety of other locations • OTHER: Catch all category for all other trips not assigned any of the purposes listed herein • RECREATION: Trips to recreational destinations such as parks and swimming pools • REGION_ARRIVAL: Trips to a port-of-entry, such as an airport, or freeway crossing • REGION_DEPARTURE: Trips to a port-of-exit, such as an airport, or freeway crossing • SCHOOL: Trips to schools such as community colleges and universities • SHOP: Trips to stores and other commercial centers • SOCIAL: Trips for social activities • STAGE: Trips made by non-residents that start and end outside the region • WORK: Trips where the destination is the person's workplace |
| timezone | String | America/Los_Angeles | Timezone of the trip’s start location, using standard tz naming conventions. |
| start_time | Time | 2019-01-10 06:08:00 America/Los_Angeles | Date and 24-hour time of trip start, reported as yyyy-mm-dd hh:mm:ss timezone. |
| start_local_hour | Integer | 12 | Hour of day that the trip started, reported in the local time zone in 24-hour time format. Values in this field range between 0 and 23. |
| end_time | Time | 2019-01-10 07:11:04 America/Los_Angeles | Date and 24-hour time of trip end, reported as yyyy-mm-dd hh:mm:ss timezone. |
| end_local_hour | Integer | 14 | Hour of day that the trip ended, reported in the local time zone in 24-hour time format. Values in this field range between 0 and 23. |
| duration_minutes | Integer | 63 | Duration of trip in minutes, calculated as the difference between the trip start_time and end_time. |
| distance_miles | Float | 10.79997335 | Distance in miles measured along the trip route. |
| transit_route_ids | String | Capital Metro:803 | The ID of the transit route used for a trip. Only applies to trips with mode as “PUBLIC_TRANSIT.” Transit Agency name and Route ID pulled from agency’s GTFS feed. |
| network_link_ids | String | 10541610554341416382 | Unique ID assigned to the link (road segment) that the trip is associated with. |
| vehicle_type | String (Len 20) | PASSENGER_CAR | The vehicle type assigned to the vehicle of the synthetic trip. Valid values are: • PASSENGER_CAR • MEDIUM_COMMERCIAL: Medium-duty commercial vehicles (14,000 - 26,000 lbs) • HEAVY_COMMERCIAL: Heavy-duty commercial vehicles (>26,00 lbs) • MOTORCYCLE Note: If values are NULL, this means that this data is not available for the region yet but we hope to have it soon. |
| vehicle_fuel_type | String | ICE | The fuel technology assigned to the vehicle of the synthetic trip. Valid values are: • ELECTRIC: Battery Electric Vehicle • OTHER_NON_BEV: Non-Battery Electric Vehicle • UNKNOWN_FUEL_TYPE Note: Vehicle Fuel Type is only modeled for private auto trips. For each private auto trip, the value will be ELECTRIC (trip was taken in a battery electric vehicle) or OTHER_NON_BEV (trip was taken in a non-battery electric vehicle). For trips with other modes, like TNC or Auto Passenger, the value will be UNKNOWN_FUEL_TYPE. |
| origin_bgrp | String (Len 12) | 410510010004 | The US Census Bureau-assigned FIPS code of the block group from which the trip originated. |
| origin_bgrp_lat | Float | 45.492294 | Latitude of the geometric centroid for the origin block group, reported in decimal degrees, WGS 84. |
| origin_bgrp_lng | Float | -122.65334 | Longitude of the geometric centroid for the origin block group, reported in decimal degrees, WGS 84. |
| destination_bgrp | String (Len 12) | 410510079001 | US Census Bureau-assigned FIPS of the block group in which the trip ended. |
| destination_bgrp_lat | Float | 45.557407 | Latitude of the geometric centroid for the destination block group, reported in decimal degrees, WGS 84. |
| destination_bgrp_lng | Float | -122.54931 | Longitude of the geometric centroid for the destination block group, reported in decimal degrees, WGS 84. |
| origin_land_use_l1 | String | residential | The primary land use category of the trip origin. Valid values are: • residential • commercial • mixed_use • industrial • civic_institutional • transportation_utilities • open space • agriculture • other • unknown |
| origin_land_use_l2 | String | single_family | The secondary land use category of the trip origin. Valid values are: • single_family • multi_family • office • retail • non_retail_attraction • education • healthcare • military • civic_institutional • transportation_utilities • open_space • agriculture • other • unknown |
| destination_land_use_l1 | String | commercial | The primary land use category of the trip destination. Valid values are: • residential • commercial • mixed_use • industrial • civic_institutional • transportation_utilities • open space • agriculture • other • unknown |
| destination_land_use_l2 | String | non_retail_attraction | The secondary land use category of the trip destination. Valid values are: • single_family • multi_family • office • retail • non_retail_attraction • education • healthcare • military • civic_institutional • transportation_utilities • open_space • agriculture • other • unknown |
| origin_building_use_l1 | String | residential | The primary building use category of the trip origin. Valid values are: • residential • commercial • mixed_use • industrial • civic_institutional • transportation_utilities • open space • agriculture • other • unknown |
| origin_building_use_l2 | String | single_family | The secondary building use category of the trip origin. Valid values are: • single_family • multi_family • office • retail • non_retail_attraction • education • healthcare • military • civic_institutional • transportation_utilities • open_space • agriculture • other • unknown |
| destination_building_use_l1 | String | commercial | The primary building use category of the trip destination. Valid values are: • residential • commercial • mixed_use • industrial • civic_institutional • transportation_utilities • open space • agriculture • other • unknown |
| destination_building_use_l2 | String | non_retail_attraction | The secondary building use category of the trip destination. Valid values are: • single_family • multi_family • office • retail • non_retail_attraction • education • healthcare • military • civic_institutional • transportation_utilities • open_space • agriculture • other • unknown |
| trip_type | String | II | Indicates whether or not the trip started or ended inside or outside of the core model region. Valid values are: • II: core > core region • IE: core > donut region • EI: donut region > core region • EE: donut region > donut region |
Methodology
Use the link below to see Replica's seasonal mobility model methodology:
Updated 3 months ago