A shift is underway on America’s roads.
As electric vehicles go mainstream, public agencies across the country are making new investments in EV charging infrastructure to support them. Now it’s time for cities, states, and MPOs to consider equity — specifically, how to invest new federal infrastructure funds to support an equitable deployment of EV charging technology.
The Infrastructure Investment and Jobs Act dedicates $12.5 billion toward electric vehicle technology and requires public agencies to prioritize equitable outcomes. The Federal Highway Administration, meanwhile, is developing guidance for how IIJA funds can be used to promote equity in the deployment of EV charging infrastructure. (Read Replica’s recommendations to FHWA here.)
So what does an equitable rollout of electric vehicle infrastructure look like?
It will likely look different depending on mobility and socioeconomic patterns in each place, but there are some key questions that can help guide planners and policymakers in this mission, including:
- How does existing EV charging infrastructure serve low-income communities?
- How do underserved or disadvantaged communities use the transportation network?
- Where do underserved communities rely more on their cars each day (i.e., they have higher daily VMT)?
- How mobility and gas-station spending change during extreme weather
We’ve built an interactive map to illustrate how comprehensive data can help answer these questions and drive equitable decision-making. For demonstration purposes we’ve focused on Los Angeles County, a place with significant EV charging infrastructure and a diverse set of communities with differing activity patterns and needs.
The map was created with Unfolded using Replica data on VMT by Census block group, EV charger data from the U.S. Department of Energy, and air quality data from the California Office of Environmental Health Hazard Assessment. You can toggle layers for each dataset above or explore a larger version of the map here.
We’ve highlighted some takeaways below.
EV Charging Locations and Income

While electric vehicles are becoming more affordable, they remain most accessible to higher-income households. The locations of publicly available charging locations tend to reflect that.
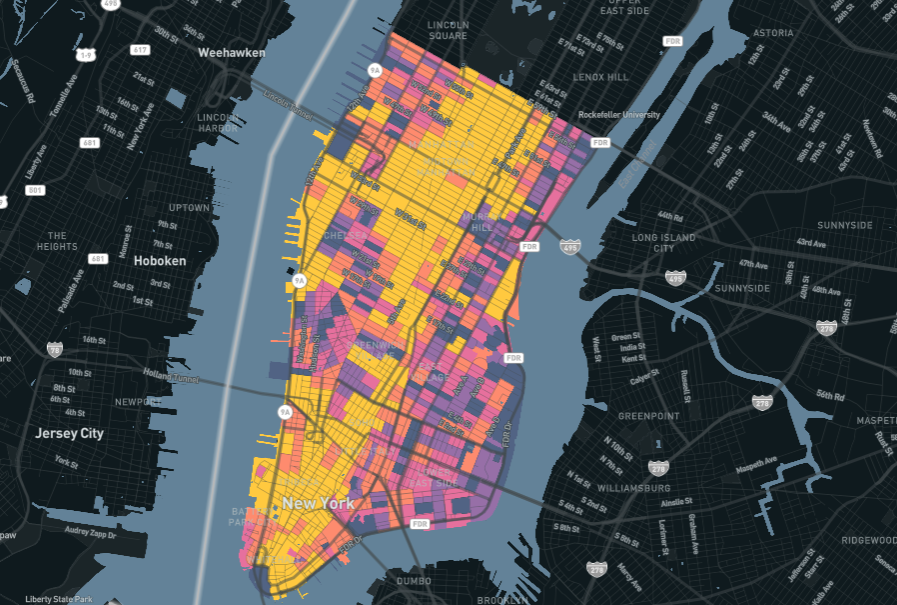
Chargers (represented by yellow dots on our map) are concentrated downtown and across high-income communities, especially to the west. Lower-income communities south of downtown, meanwhile, have far fewer charging locations.
This shows us one dimension of access, but it’s also important to know how charging locations interact with people’s mobility activity.
Where EVs Meet VMT

Range anxiety — a driver’s fear that a car’s battery can’t get them where they need to go — is a hurdle to EV adoption. It’s also the case that EVs with longer ranges tend to be more expensive.
Unless that changes, low-income households — especially those that drive more on a daily basis — could be disproportionately affected by range anxiety, and thus face a higher barrier to joining in and benefitting from the energy transition.
The map above offers a glimpse at how existing EV infrastructure aligns with where people are doing more driving.
Many places in the LA metro area have higher daily VMT per capita and considerably less access to publicly available EV charging locations. This is especially true in the southern, eastern, and northern parts of the core metro area.
In several neighborhoods, commuters with low household incomes have access to fewer EV charging stations and need to drive farther than those who live in wealthier neighborhoods with more charging locations. Examining these areas closely can empower public agencies with the insights they need to improve access to EV infrastructure where it can have the most impact.
EV Infrastructure in Rural Corridors
Rural areas have their own circumstances that are important to consider for EV infrastructure.
People who live in rural areas tend to take longer trips, and may even be super-commuters into the urban core. They may also have easier access to at-home chargers compared to people in higher-density urban areas.
At the same time, drivers passing through rural areas on long trips will need publicly available charging stations in rural corridors where there may be less demand among local residents.
The map below shows daily VMT per capita and EV charging stations in the more rural northern stretches of Los Angeles County.

Most areas in the Antelope Valley show a daily VMT per capita above 45 — nearing half the range of many of today’s least expensive EVs. Replica data shows that the Palmdale area, north of the San Gabriel Mountains, has a high number of long-distance commuters who also have low household incomes, in an area with relatively few publicly available charging stations.
Who Could Benefit From a New EV Charging Location?
The maps above are helpful for identifying areas where new investments could address inequities. It’s also important to understand, if a site is chosen, whom it is likely to serve.
Continuing on the Palmdale example, we used Replica Places to inspect a rural stretch of California State Route 138. We’ve chosen this site for demonstration purposes only, to show what kind of information can inform who travels past a location and what those trips look like.

An average weekday in Fall 2019 saw 110,000 trips taken along this corridor. The overwhelming majority of these trips were long enough to have a meaningful impact on an EV battery’s charge. More than 88% of trips were longer than 64 miles, and the median trip distance was 112 miles.
The majority of trip-takers were non-white, and the median household income of the trip-takers was $69,000. Thirty-six percent made less than $50,000. Most trips involved people traveling to their home (41.4%) or work (18.4%). Freight accounted for 5.3% of all trips.
Assessments like these ones bring new dimensions to understanding the impact that EV infrastructure investments can have.
With a fast-evolving technology and an urgent need to address inequities, comprehensive, disaggregate mobility and socioeconomic data can take the guesswork out of infrastructure planning and investments and help build more equitable and resilient places.


.jpg)