
Data to drive decisions about the built environment

The Challenge
It is difficult to find high-quality, recent data and insights about the world we live in, the way people move, and why.


Why Replica
Replica makes it possible for everyone from DOTs to transit agencies to
real estate investors to get the holistic, accurate, and up-to-date picture they
need to make planning, operational,
and investment decisions.


What We Offer
Our platform provides customers with more than a dozen datasets, 50+ metrics, and a suite of tooling and applications that span multi-modal transportation, demographics, economic activity, land use, and infrastructure.


Why It Matters
With comprehensive data, an easy-to-use interface, and access to underlying outputs, Replica customers have what they need to unlock previously hidden insight.


Replica In Action
.png)
.png)
.png)
Prioritizing the right locations for EV Charging Infrastructure.
Washington State Dept. of Commerce worked with the Timmons Group and Replica to create a tool to help applicants for the state’s Clean Transportation Community Charging Grant Program.
The state has a goal of strategically locating more than 5,000 chargers. The Replica-powered tool maps all existing charges statewide. For measuring the potential impact of future locations, the tool enables local applicants to identify parcel-level characteristics, including Trip Count and Dwell Time.


How much gasoline do Americans use every day?
Americans burn millions of gallons of fuel every day to get where they’re going. With Replica, it’s possible to quantify gas usage on individual roadway segments to help inform policy and planning decisions.
We looked at the relative gasoline usage on four 1-mile stretches of roadway across the country.

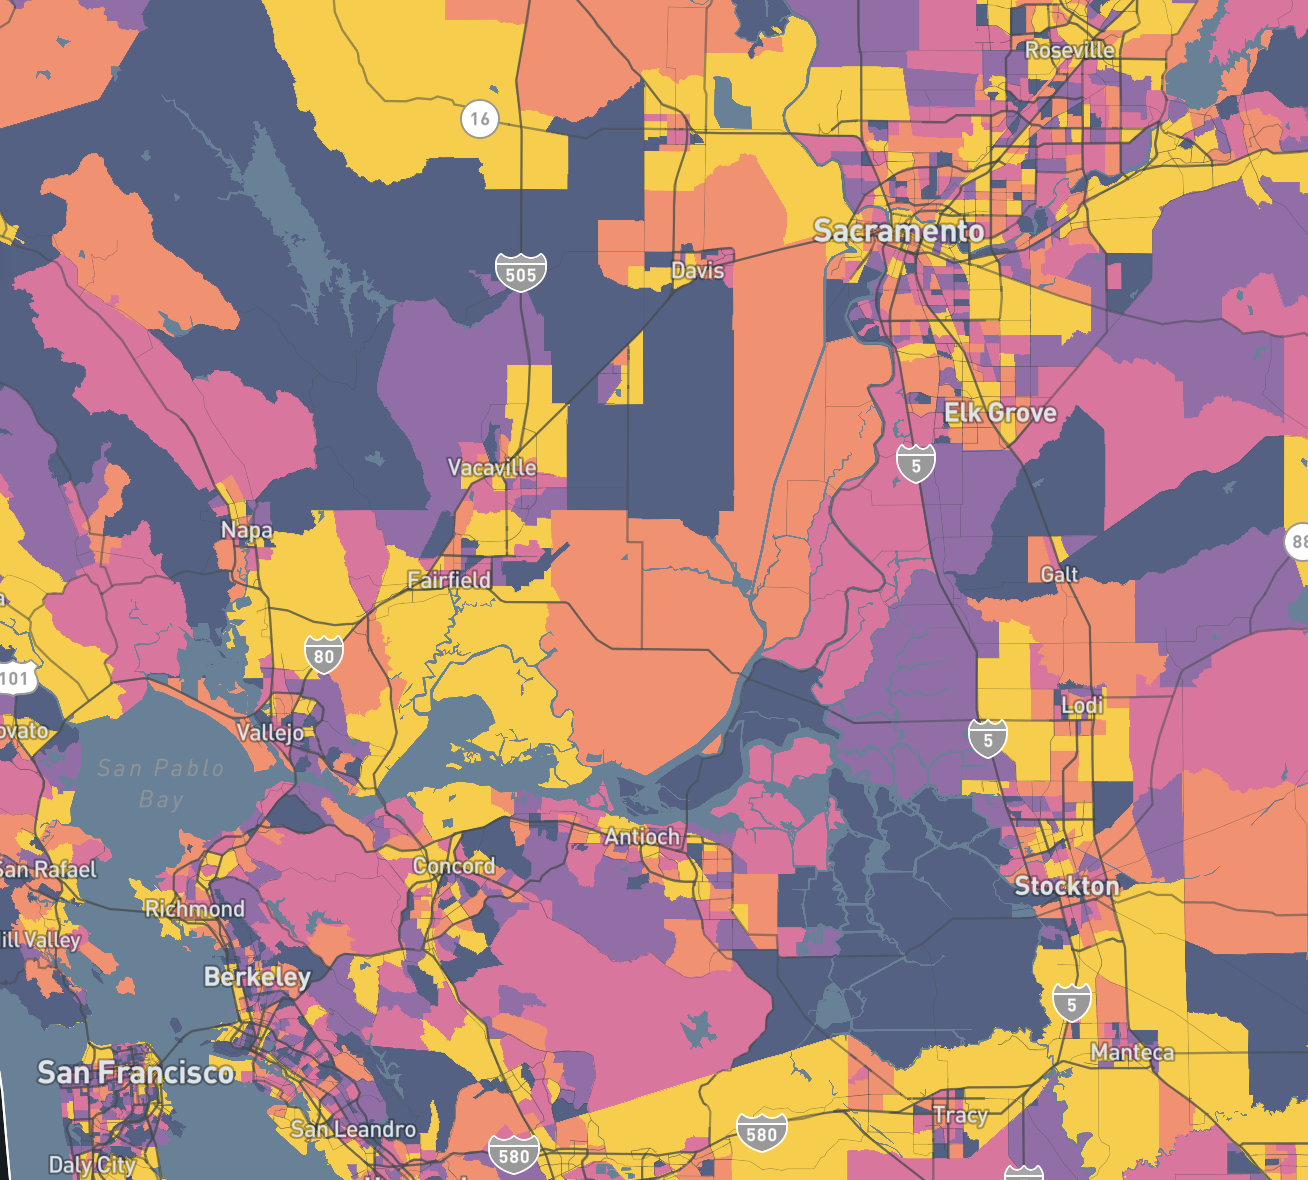
How many miles a day do residents in your county travel?
We used Replica data to publish an interactive map of the average daily miles traveled by a resident of each county in the US, and the average number of miles traveled only via walking and biking in each county each day. Some nationwide trends:
- A Nation of Car Trips: Of the 10.7 billion miles traveled each day, 97.9%—10.5 billion miles—are traveled in a private automobile or transportation network company car, like Uber or Lyft.
- Active Transportation: Less than 1% of miles traveled are via active modes like walking or biking
- Public Transportation: only 1.2% of all miles traveled are via public transportation. Across the country’s 3,143 counties, in only 16 do public transit trips make up more than 5% of total mileage
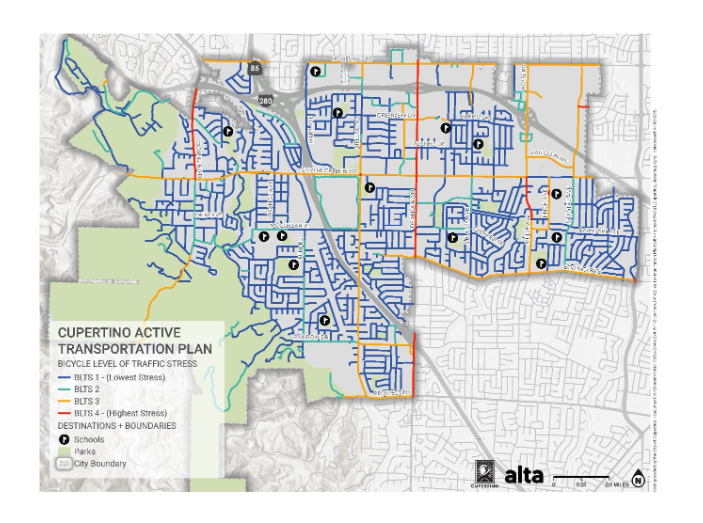
Measuring Chicago’s Boost in Biking
With Replica, the Chicago Department of Transportation (CDOT) quantified the remarkable impact of its continued investments in expanding and improving the city’s bike network.
Over the last four years, Chicago has seen significant growth in cycling trips across the city. Replica worked with CDOT to analyze biking trends across the entire city, while exploring the characteristics of people and trips that saw the greatest changes. The analysis validated the agency’s “Chicago Cycling Strategy” and its approach to creating a cycling system that better serves everyone, with a focus on providing low-stress options, working with community stakeholders, and filling gaps in the citywide network.

Who’s biking, where are they going, and why
The Florida Shared-Use Non-motorized (SUN) Trail network is a developing statewide system of paved multi-use trails for bicyclists and pedestrians, physically separated from the road.
With Replica, it’s possible to zoom in on a specific trail and understand usage patterns like active mode split, demographic characteristics, and whether the trail is more popular with visitors or residents, commuters or
recreational trip takers.

Obtaining population and employment figures for transit walk sheds
With Replica, you can easily draw custom geographies for walk sheds for different transit service plans, and get summary statistics for those who live and work within the walk shed.
Jim Bunch, EIT PTP, Senior Transportation Planner at Mead & Hunt, used Replica for this analysis in Glenwood Springs, Colorado, saying, “I just used Replica. Really cool and useful. This would be almost impossible to do in GIS using TAZs and/or Block Groups.”

Mapping EV VMT by County
Replica data can identify where around the country EV adoption is strongest, and then analyze the characteristics
of EV-specific trips.
The country has only begun to deploy the billions of dollars allocated to investing in EV charging infrastructure across the country, and Replica is helping agencies and private companies around the country figure out how to most effectively deploy those investments to best serve local populations.
Measuring the home team’s economic impact
With Replica Patterns, it’s possible to quantify the increase in visits due to events, policy changes, and initiatives. We analyzed how Orioles home games impacted the activation of the Inner Harbor shopping + restaurant corridor. We analyzed the activity in Inner Harbor on Summer ‘23 Tuesday and Wednesday nights when the Orioles were home, compared to nights when there wasn’t a game.
We see a 27% increase in shops and restaurants visits to the Inner Harbor on game Tuesdays and Wednesdays. Combining this insight with Replica’s consumer spend data, we can estimate that these games generate hundreds of thousands of dollars of extra spending each game night, in just one square mile.
.png)
Analyzing a custom walkshed for transit ridership
Replica data can help draw walksheds for proposed and existing transit routes and stops to identify potential ridership pools and trip characteristics of those within walking distance of the proposed facilities.
METRORapid is Houston Metro’s Bus Rapid Transit system and is planning the University Corridor Project, a key component of the METRONext Plan, which will combine light rail and bus elements along a 25.3 mile corridor. The corridor provides access to four colleges and universities, and Replica data shows how students and others will benefit from this proposed service.

Texas A&M Transportation Institute (TTI) validates Replica’s Average Annual Daily Traffic (AADT) data
TTI's compared AADT and hourly volumes estimates from both Replica and Inrix, against observed data collected by TxDOT’s permanent count stations across the state.
The analysis found a high correlation between Replica’s AADT dataset and the observed counts, evidenced by a Mean Absolute Percentage Error (MAPE) of 12.1%. Similarly, the hourly volume estimates showed a strong correlation, with a MAPE of 23.7%.
TTI’s findings underscore the close alignment between Replica's AADT and hourly volume estimates, and TxDOT’s observed data. This level of accuracy is crucial, especially considering the challenges State Departments of Transportation (DOTs) face in counting traffic across every road segment.

Just how bad is George Washington Bridge traffic?
We’ve visualized typical speeds approaching the George Washington Bridge in New York from both the North and South. Serious congestion in the PM peak is clear in both directions, while not surprisingly, AM traffic is much worse coming into NYC, as commuters stream into Manhattan.
With Replica’s Network Speeds Viewer you can instantly obtain similar data for traffic choke points in your jurisdiction.
.png)
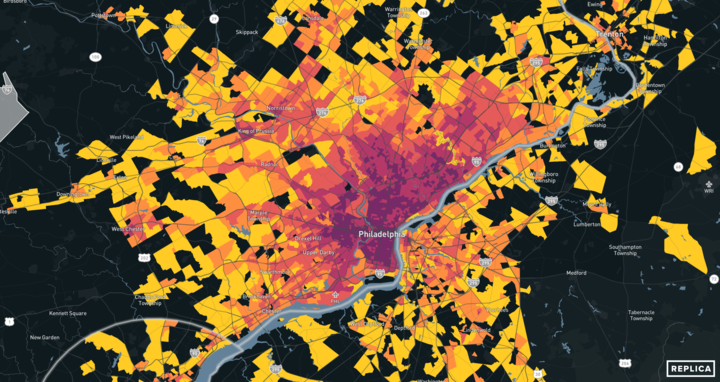
Mapping population density across the 24 hour day
Even in the post-pandemic, work from home world, the flow of commuters have a major impact on our cities.
With Replica’s minute by minute data, we can look at the population density at any specific point in time.
In this visualization, we explored the flow of people in and out of New York City in a typical weekday in 2023.
In NYC, we see a noticeable flattening of the AM/PM peak – people come in later and leave earlier, creating a less extreme, but longer rush hour crush.

.webp)
Replica Use Case Library
Trusted by:


Customer testimonials:


