
New York City launched one of the largest transportation policy experiments in U.S. history when it rolled out congestion pricing in January 2025. To see how congestion pricing changed life for New York residents and visitors, from traffic flows to transit access, researchers and city officials relied on Replica’s mobility data. Twelve months later, the results are clear: fewer cars in the Central Business District, faster travel speeds, and more people choosing transit.
A recent New York Times interactive feature and an academic working paper led by Cody Cook, with contributions from Google Research, analyzed the short-run impacts of the program relying in part on Replica’s transit stop-level and trip-based outputs to evaluate how travel behavior shifted after pricing began.
What did New York City aim to achieve with congestion pricing?
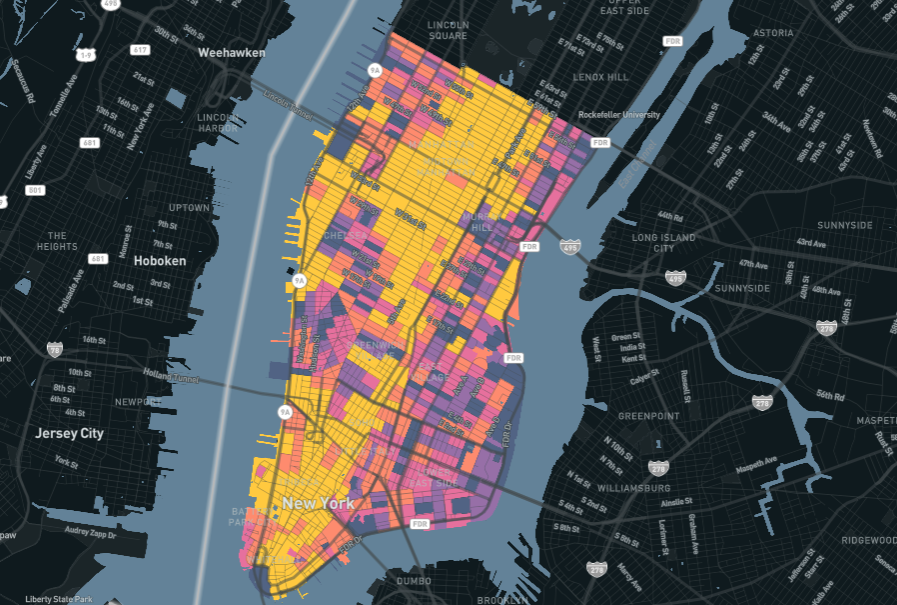
New York City's congestion pricing program charges most drivers $9 during peak travel times to enter Manhattan below 60th Street. The scheme intended to achieve three simple goals:
- Reduce vehicle volumes
- Improve travel speeds and reliability for all modes
- Support transit investment through new revenue
But measuring whether a policy that affects millions of daily trips achieves those goals requires more than a few traffic counters, it requires high-resolution, citywide mobility data.
What has been the program’s impact on New York City?
Researchers from Stanford, Yale, National Bureau of Economic Research (NBER), and Google Research used Replica to estimate tract-to-tract trip counts for over 182 million weekly trips across the New York City metro area. By combining Replica's comprehensive trip volume data with local data sources, the study found that New York City’s congestion pricing delivered:
- 11-13% sustained reduction in vehicular entries to the congestion zone (~73,000 fewer vehicles daily)
- 11% increase in speeds on CBD roads, with up to 13.5% gains on major tunnels and bridges
- Speed improvements throughout the metro area, including spillover benefits to neighboring regions like New Jersey and outer boroughs
- Increased subway and bus ridership, with 300,000+ more daily subway riders and 2.4% faster bus speeds in the zone
- No decline in commercial activity: foot traffic, restaurant reservations, and retail visits remained stable or increased
- 653 tonnes of CO₂ saved weekly through improved fuel efficiency
- Driver welfare gains of at least $14.3 million per week, with 97% of benefits coming from time savings on 180 million unpriced trips outside the tolled zone
- 8.6% reduction in serious traffic injuries and 17% fewer vehicle noise complaints within the zone
- Approximately 75% of the observed speed increase was directly attributable to congestion pricing, not broader regional patterns when compared against other cities
Taken together, these findings show that congestion pricing in New York City produced broad, measurable benefits.
What was Replica’s role in the analysis?
Replica’s mobility insights answered fundamental questions and filled data gaps where local counts and surveys fell short. Replica delivers a complete, multi-modal view of how people move through cities, including:
- Trip-level travel patterns across all modes
- Transit stop-level ridership and access insights
- Spatial comparisons between the priced zone and surrounding areas
- Baseline and post-policy comparisons over time
In the congestion pricing study, Replica data helped researchers:
- Measure how travel demand shifted across the city
- Analyze multimodal impacts, including transit use
- Compare NYC’s outcomes to similar regions using synthetic controls
Looking Ahead
New York City's first year of congestion pricing proves that data-driven policy can deliver real, measurable results. As more cities explore demand management strategies, access to comprehensive, high-resolution mobility analytics will be critical for designing smarter policies, tracking outcomes, and continuously improving how urban transportation systems perform.
Replica is proud to power the data and tooling behind these decisions, helping cities move faster, smarter, and more efficiently.


.jpg)