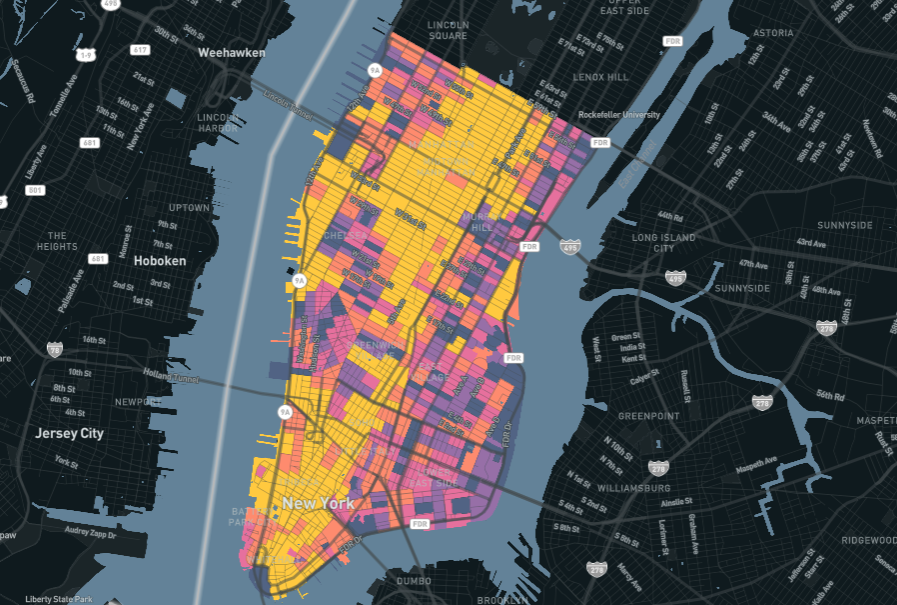
Every five years, the Chicago Metropolitan Agency for Planning (CMAP) produces an inventory of greenhouse gas emissions for the region’s seven counties. With this year’s report, CMAP used Replica data to provide more local information than ever before.
CMAP’s latest greenhouse gas inventory, covering emissions activity in 2019, includes greenhouse gas summaries for each of the 77 Chicago Community Areas and 284 municipalities across northeastern Illinois. These local summaries lend new nuance to the traditional county-level inventories that track the region’s progress toward its climate goals.
While overall emissions are declining in the region, transportation emissions are on the rise. That can almost all be attributed to on-road vehicle activity and rising vehicle-miles traveled, said CMAP Senior Planner Jared Patton, the project manager for the regional greenhouse gas inventory.
With more granular data for transportation emissions, each place can now see its contributions to the region’s emissions and begin to take action.
“The summaries are intended to provide communities with most of the information they need to get started reducing their emissions. That way, they can focus their efforts on implementation, rather than gathering and analyzing data.” Patton said.

Finding the right data on trips and modes
For its local emissions summaries, CMAP assigned emissions from private auto and commercial vehicle trips to each municipality or community area for trips taken in 2019. Replica provided key data about the types of vehicles traveling and the locations of those trips.
CMAP leveraged Replica’s data on transportation modes and origin-destination points to identify the number of private auto and freight trips that:
- remained entirely within each jurisdiction.
- traveled into or out of each jurisdiction.
With that information, the agency assigned all emissions to one jurisdiction for each internal trip, split emissions across two jurisdictions for each trip that started and ended in different jurisdictions, and factored out trips that were passing through on a longer journey.
Saving time with flexible geographic analysis
For this project, it was important to obtain data by municipal and community area boundaries. At that level, CMAP’s findings are immediately relevant to local stakeholders throughout the region, including community boards, city staff, and sustainability directors.
Normally it would take a significant amount of staff time to organize the agency’s internal trip data by these political boundaries, said CMAP Analyst Sarah Buchhorn.
“Our in-house travel model is organized by TAZ [transportation analysis zone], so it would have required more post-processing,” she said. “Replica offered us trip tables that were ready to go at the level we needed them.”
Now, CMAP is focused on community outreach, working with those local stakeholders to show that much of the difficult work of getting reliable data on local emissions has already been done.
“It’s important that we did this work,” Buchhorn says. “We got these numbers out there that give an indication of how our region is doing. Hopefully people can understand it and act on it — and then we will see improvements.”


.jpg)