By David Proffitt, Metro Analytics Research & Development Manager
As transportation professionals work to address a surge in pedestrian fatalities across the country, the need for new tools to analyze pedestrian-involved traffic crashes is clearer than ever.
Historically it has been challenging to identify the most dangerous locations for pedestrians because detailed data about where and when people walk has been difficult or impossible to come by.
Using Replica’s granular data on pedestrian activity — and integrating it with public data on vehicle and pedestrian crashes and other big-data sources — Metro Analytics developed an Urban Safety Explorer tool that enables new analyses about pedestrian risk and activity.
This tool allows us to:
- Understand where pedestrian-involved crashes occur at high rates compared to the number of trips along individual roadway segments
- Identify places where people walk less (or more) than expected given surrounding demographics and land uses
- Perform equity analyses that reveal where low-income and nonwhite populations face higher crash rates when walking
To see this in action, we can look at Broward County, Florida. For this case study, Metro Analytics joined trip and traveler data from Replica’s nationwide activity-based travel model based on synthetic populations with public data on crashes (from the Florida Department of Transportation), driving-behavior data from Ford Mobility’s connected-vehicle fleet, demographics data from the Census, employment data from LEHD, and land-use data from Replica, Google, and public sources.
Understanding Pedestrians’ Exposure to Danger
When it comes to understanding where pedestrians face the greatest risks, pedestrian-involved crash data on its own is limited. Often it’s only reflecting where there’s more walking activity, highlighting busy locations rather than especially dangerous ones.
But with granular data on walking trips, we have new ways to measure pedestrian safety. It allows us to normalize crash rates by the number of trips across all modes, including walking, biking, transit trips, cars, and freight. Normalizing crash rates by the number of trips — either by mode or aggregated for all modes — along a specific stretch of street reveals where pedestrians are more likely to be hit, not just where they are more likely to be.
In Broward County, Metro Analytics normalized crash rates by exposure to pedestrian-vehicle conflicts using a standard formula recommended by the Federal Highway Administration. That formula calculates the number of pedestrian-involved crashes per 100,000 trips across all modes for individual roadway segments.

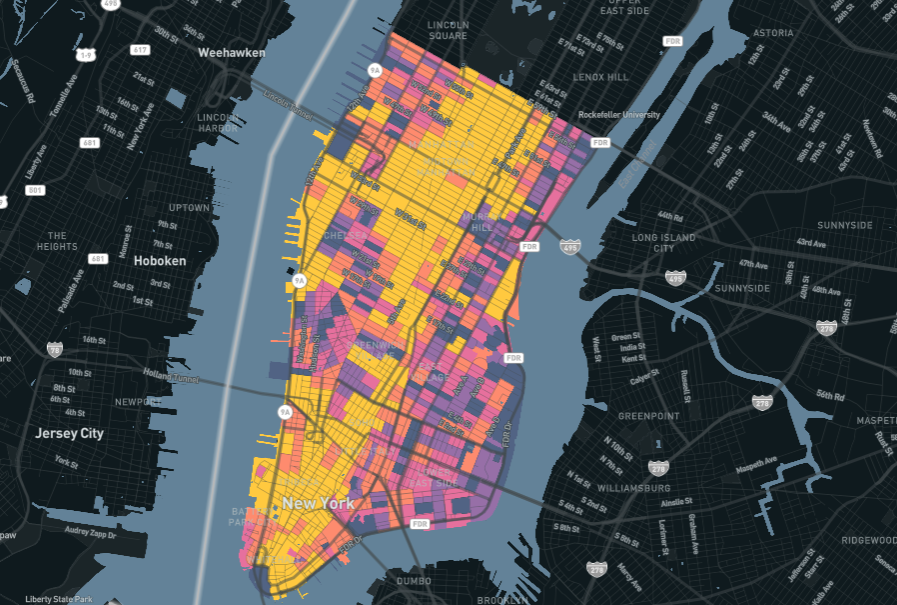
This analysis of pedestrian-involved crashes found five areas with high normalized crash rates relative to the rest of the county. Each red dot on the map above represents a location where there were more than 18 pedestrian-involved crashes per 100,000 trips (all modes) from 2014 to 2018.
The locations are all concentrated near the coast in the more populous eastern part of Broward County in (from north to south) Deerfield Beach, Pompano Beach, Fort Lauderdale, and Hallandale Beach. Three of the five locations are along US 1, a non-interstate federal highway that runs north and south and provides access to beaches and downtown Fort Lauderdale. Another is near downtown Fort Lauderdale, near the city’s main convention center. The fifth location is at the intersection of two major arterials in Pompano Beach.

The next step is identifying “underwalked” areas where Replica’s model shows fewer walk trips than expected. This mismatch can help agencies identify priority locations where missing pedestrian infrastructure – such as sidewalks, crossing signals and striping, or street-calming measures – can improve safety and encourage walking. Similarly, places with more walk trips than expected can be identified to examine what conditions are supporting or encouraging walking behavior there.

Assessing Pedestrian Equity
Walking data can also help agencies pinpoint equity issues by showing where pedestrian-involved crash rates (normalized by the number of walk and other trips) occur in neighborhoods with a high proportion of low-income and non-white populations. (The environmental justice index we use here is a combination of the proportion of households living in poverty and nonwhite population living in a Census block.)
Analyzing where high rates of pedestrian-involved crashes coincide with vulnerable communities can help decision-makers prioritize projects that will improve safety and walking accessibility in these neighborhoods. Tracking equity-related safety metrics over time can also show how quickly a community is making progress toward its goals.

Replica data on walking trips also allows for a new way to measure equity when it comes to pedestrian safety.
We wanted to know if people living in neighborhoods with high proportions of low-income and nonwhite populations face a higher probability of being hit by a vehicle while walking.
The conventional way of doing this would be to regress per capita crash rates on these demographic characteristics. Using this approach, Metro Analytics’ analysis of Broward County found the proportion of low-income residents in a Census block to be statistically significant at the standard 95 percent confidence level. The proportion of nonwhite residents in a Census block, on the other hand, was not statistically significant.
But we see something different when we swap the per-capita crash rate for the rate of pedestrian-involved crashes per walk trip. This approach is useful because it accounts for different walking behaviors across the county — and it yields statistically significant relationships between block-level demographics and pedestrian-involved crashes.
Using this innovative metric, we were able to confirm that people living in neighborhoods with
higher proportions of low-income and nonwhite residents are more likely to be struck by a vehicle while walking.
While this is bad news for Broward County, the insights provided by this novel analysis can help decision-makers better understand the scope of the problem and take steps to address it.
David Proffitt is the research and development manager at Metro Analytics.


.jpg)