Replica customers now have access to Fall 2023 Places data, our most detailed mobility data. With this release, we have:
- Improved our electric-vehicle trip data, by including more BEV ownership ground truth data from across the country so we match state-level ownership totals for all 50 states & Washington, D.C.
- Incorporate more local Work From Home data, to better reflect the increasing geographic variance in work from home rates across the country.
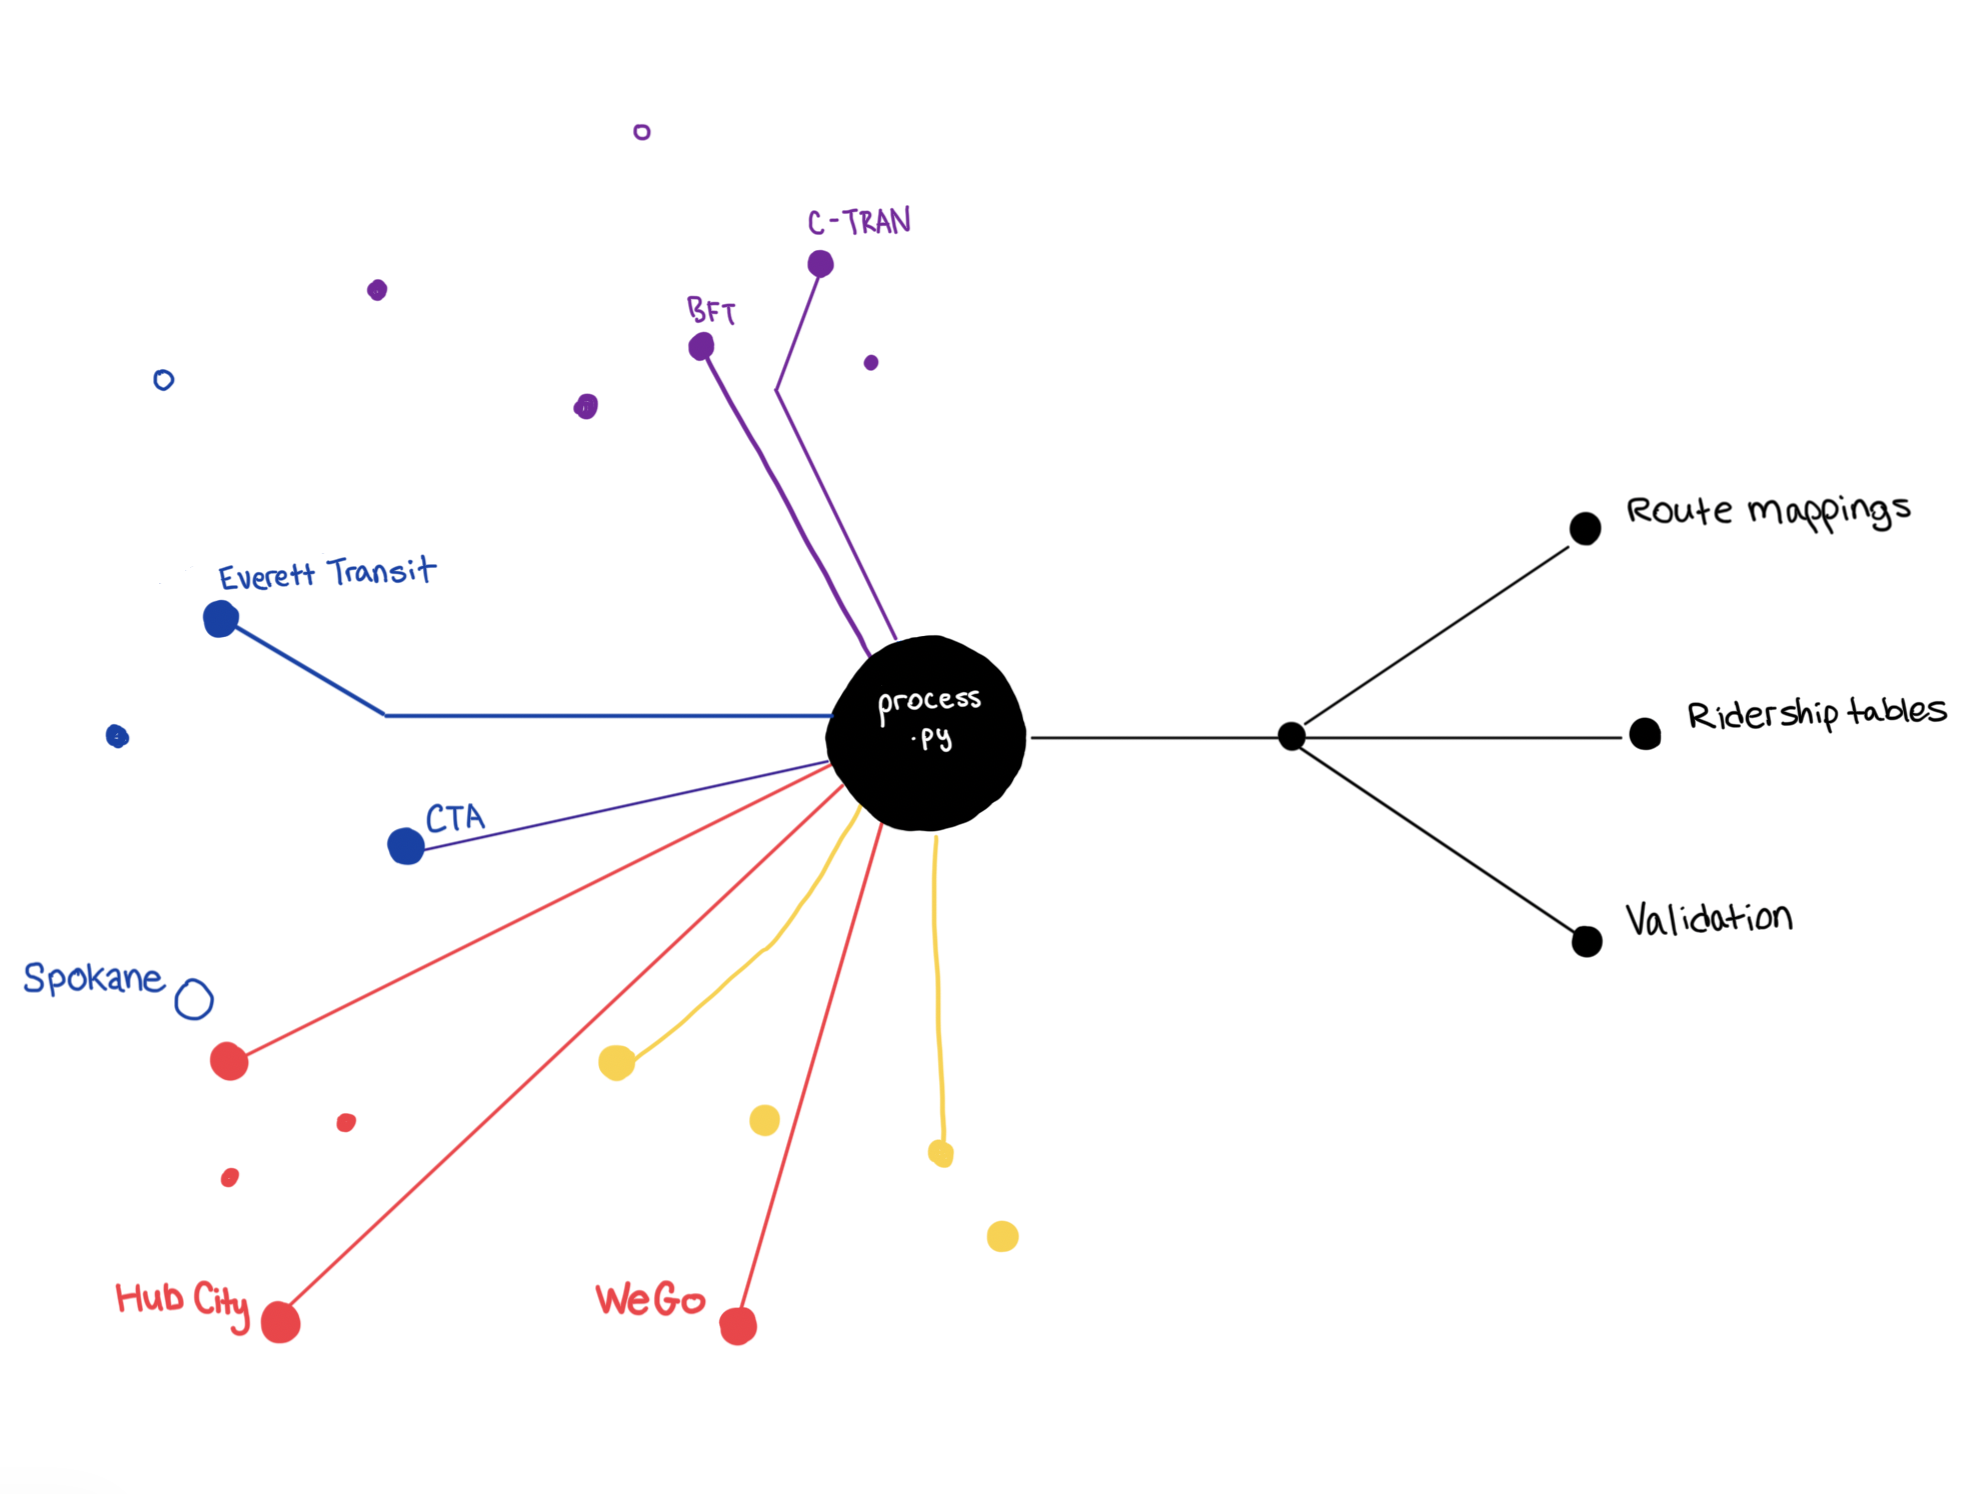
- Added data from 70 additional transit agencies, bringing our total coverage to more than 400 agencies and 11,000 for which we provide trip level data.
We dove into the Fall 2023 data for the 50 largest CBSAs in the country, and compared each region across 3 key metrics:
- VMT per capita
- Daily travel minutes per capita
- Walking mode share
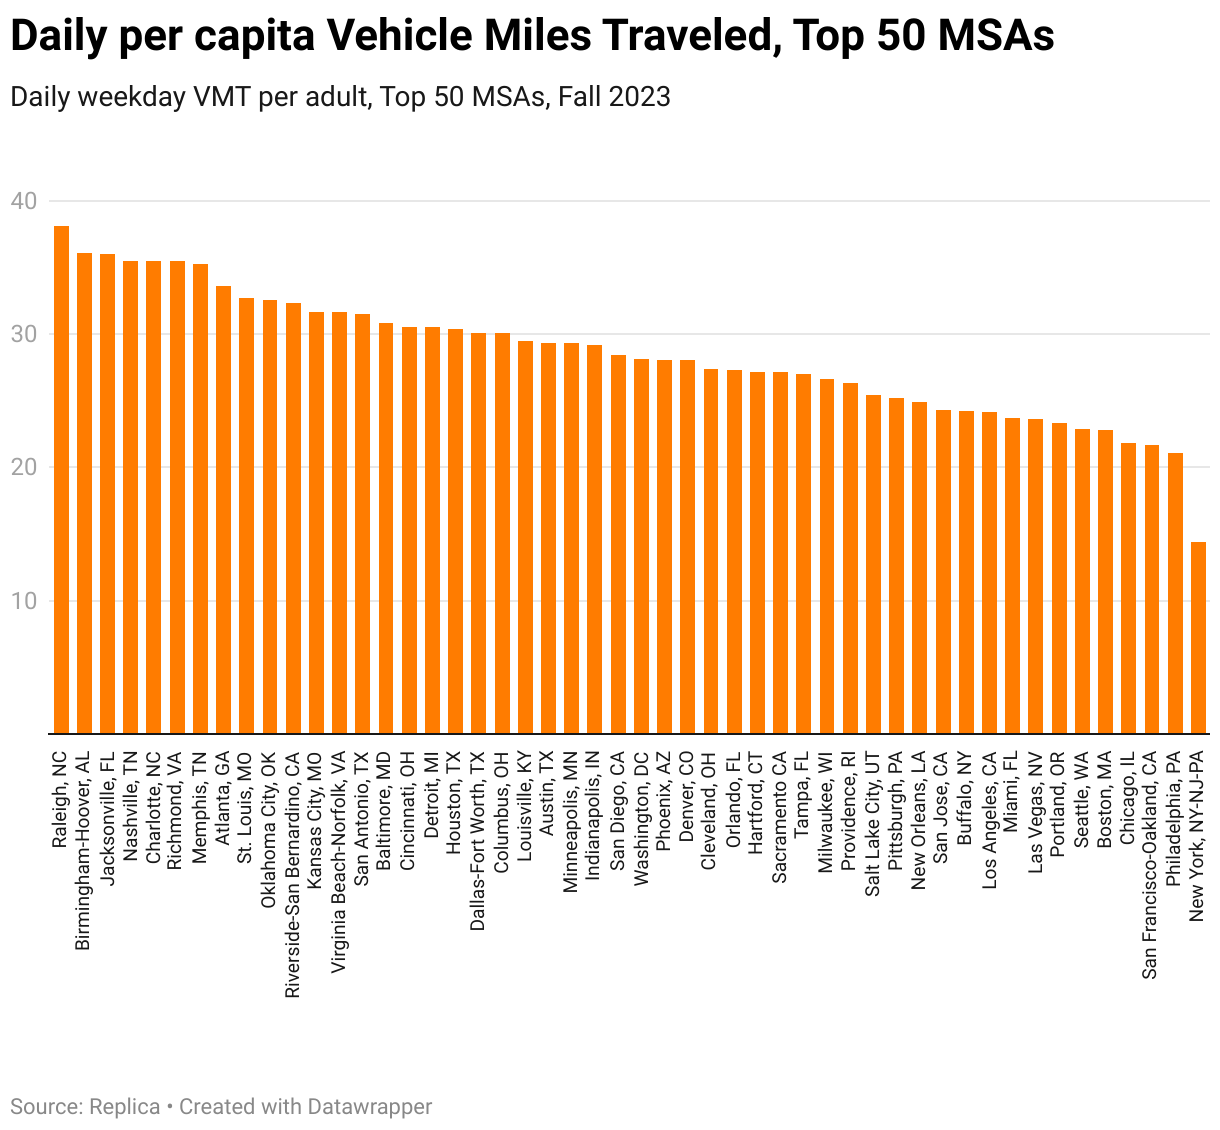
VMT Per Capita
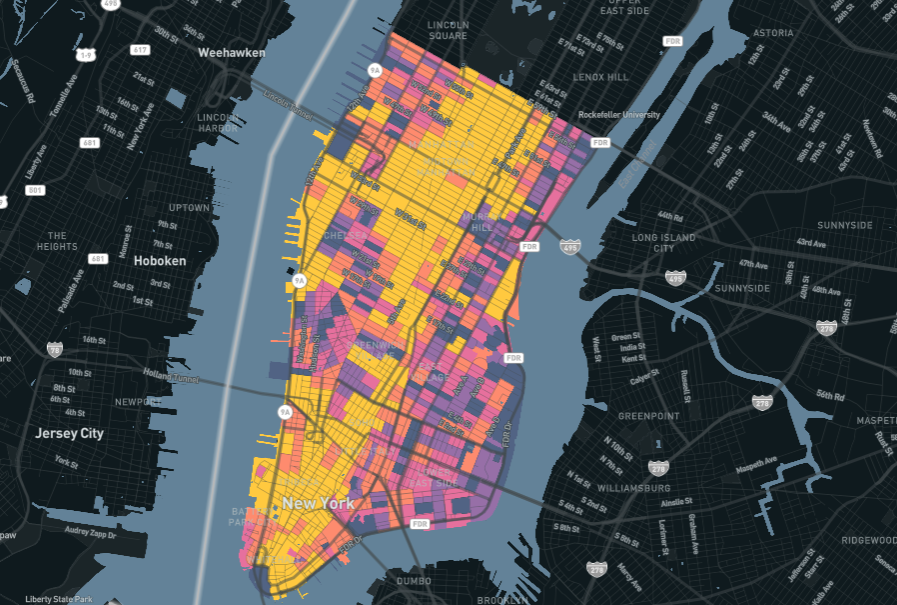
Across the top 50 MSAs, daily per capita VMT ranges from just over 38 in Raleigh, North Carolina, to under 15 in New York. Find how your city compares, and reach out for data broken down by county, census tract, or for specific income brackets or demographics.
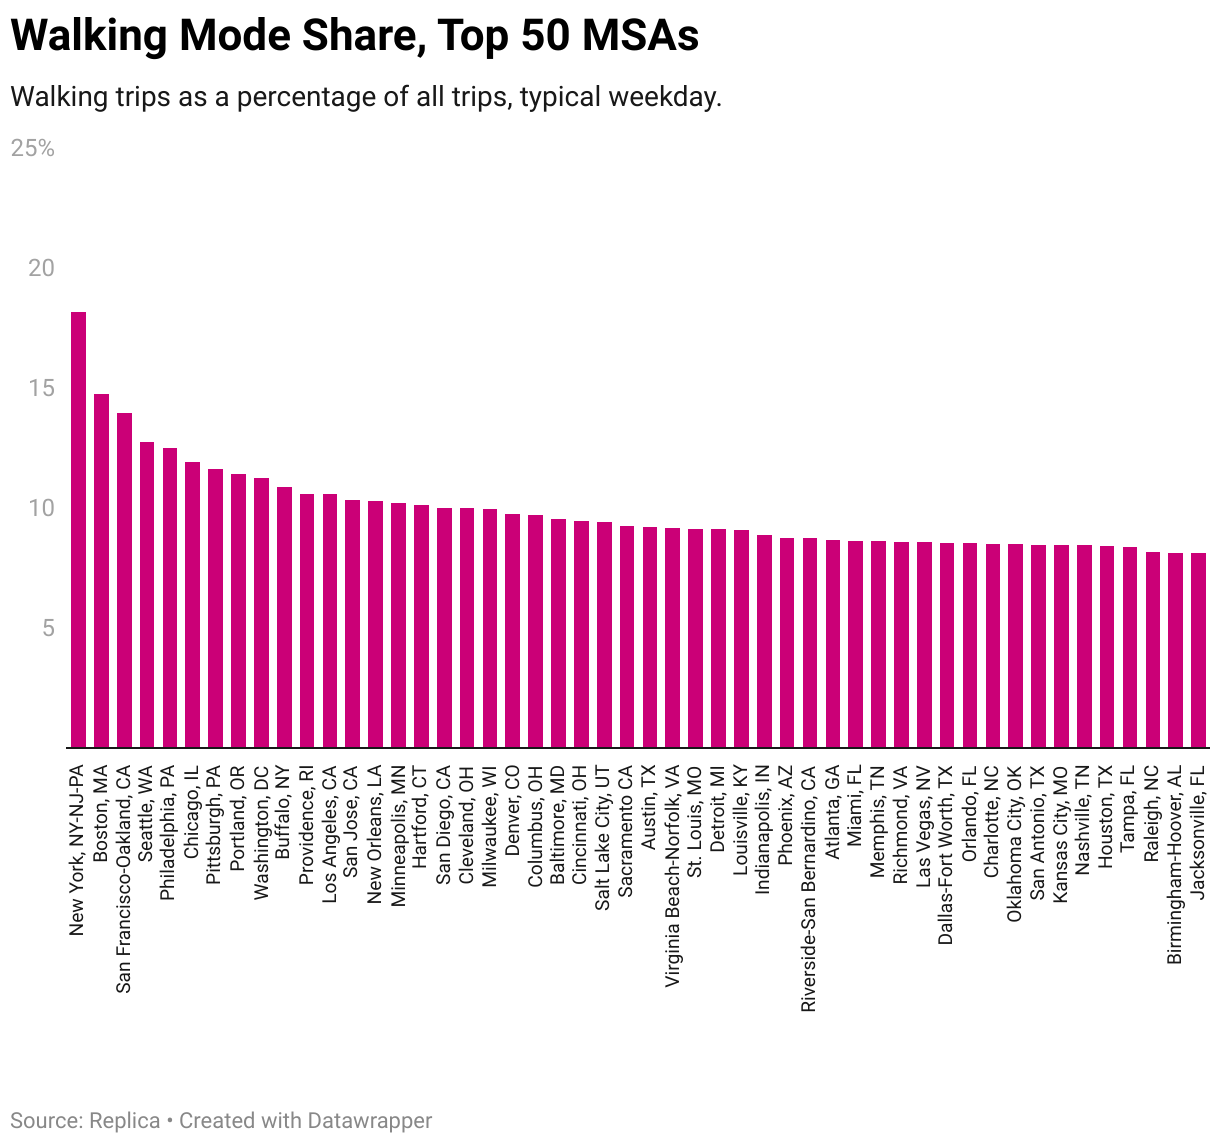
Walking Mode Share
There are many factors that go into how viable walking is as a potential mode choice in each location, but none is more important than density. That's why the New York Metro sits on the far end of the spectrum with 18% of all trips taken via walking. But weather is also a significant factor, which is why we see some of the lowest walking rates on a typical Fall day in Southern metros where the temperature might just be too hot (and the air too humid) to encourage a lot of outdoor travel.
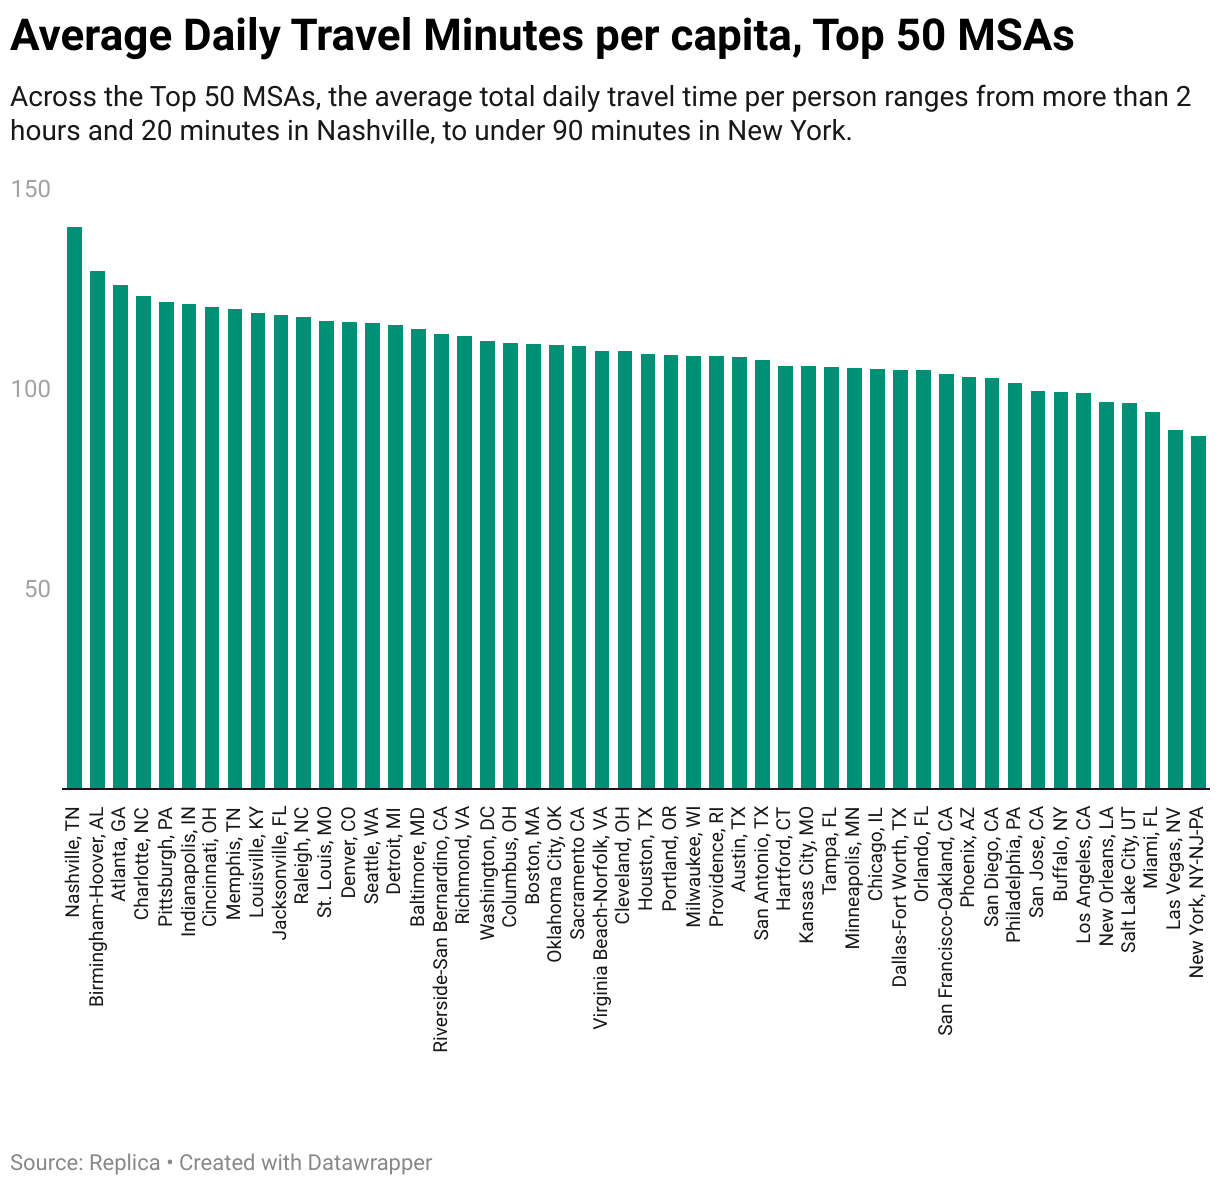
Daily Travel Minutes Per Capita
VMT doesn't equate perfectly to Daily Travel Minutes per person. First of all, not every trip is by car and in certain places, people are far more likely than in others to walk, bike, or take public transit. Second of all even for those in a car, not all traffic is equal. Daily travel minutes per person is impacted both by the distance of all the different types of trips people make, and, for the 95% of trips every day that are taken by car, how bad congestion is.


.jpg)