The following blog describes a joint project between Replica, Alta Planning + Design and HEAVY.AI. Current Replica subscribers already have access to the data in this database. Everyone has access to a subset of the dataset, visualized in Heavy.ai’s platform, and access to an Alta Flow Map that provides a deeper analysis of the Hennepin Avenue Bridge in Minneapolis. You can also reach out directly for access to the underlying database.
The collapse of the Francis Scott Key Bridge on March 26th highlights the critical role major bridges play in our transportation networks. This incident is the latest in a series of bridge collapses or closures on interstate highways, such as I-95 in Philadelphia, I-10 in Los Angeles, I-85 in Atlanta, and I-35W in Minneapolis. When these bridges are closed, local populations, particularly those without access to vehicles or alternative transportation options, are significantly impacted. While major bridge collapses make the news, smaller bridges with travel restrictions or closures also greatly affect local communities. Crumbling bridges, in particular, have become the face of a network that desperately needs the investment allocated in 2021’s Bipartisan Infrastructure Law. Despite nearly a decade of repair efforts by state Departments of Transportation, the American Society of Civil Engineers (ASCE) still rates the national bridge network at a "C" grade, indicating a near-failing condition.
The National Bridge Database, managed by the Federal Highway Administration (FHWA), contains information on 600,000 bridges in the United States, including location, classification, age, inspection history, and condition. However, it lacks detailed data on trip types, origins and destinations, and the demographics of bridge users.
This gap makes it challenging to conduct a comprehensive Vulnerability Assessment of the nation's bridges from an equity perspective. It’s that type of analysis that could help prioritize projects where the importance of a bridge to the surrounding community isn’t fully captured by just the total number of vehicles that use it.
The importance of that analysis is why Replica has joined with Alta Planning + Design and HEAVY.AI to enrich the National Bridge Database with detailed travel and trip-taker information from Replica datasets, generating a Criticality Score for each bridge. The resulting database focuses on equitable access for disadvantaged communities, freight transportation, and commuting, with the Criticality Score representing a prioritized, normalized view of bridges in order of their equitable impact to local communities. This resource can help state and local governments prioritize investments and best utilize the $9.6 billion in grants provided for the Bridge Investment Program funded by the Infrastructure Investment and Jobs Act. At the same time, the tool helps provide insight into important questions about the relationship between local communities’ socioeconomic characteristics and the infrastructure they rely on.
How We Did It
We started with the most major pieces of infrastructure by isolating bridges that cross a body of water and are at least 750 feet in length, which created a subset of 4,600 bridges (about 1% of the entire database). We then appended the database with the following additional information for each bridge, utilizing Replica’s proprietary outputs:
- Total number of daily trips
- Number of trips made by residents of Areas of Persistent Poverty (as defined by USDOT)
- Number of trips by those from households making less than 2x the poverty line
- Number of trips made by a commercial freight vehicle
- Number of active transportation (walking and biking) trips
- Origins and Destinations of all trips that utilize the bridge
This enriched database offers a new perspective by combining bridge condition information with data on who relies on the bridge. The Criticality Score helps identify where federal funds are most needed, factoring in bridge condition and the additional data points.
What We Learned
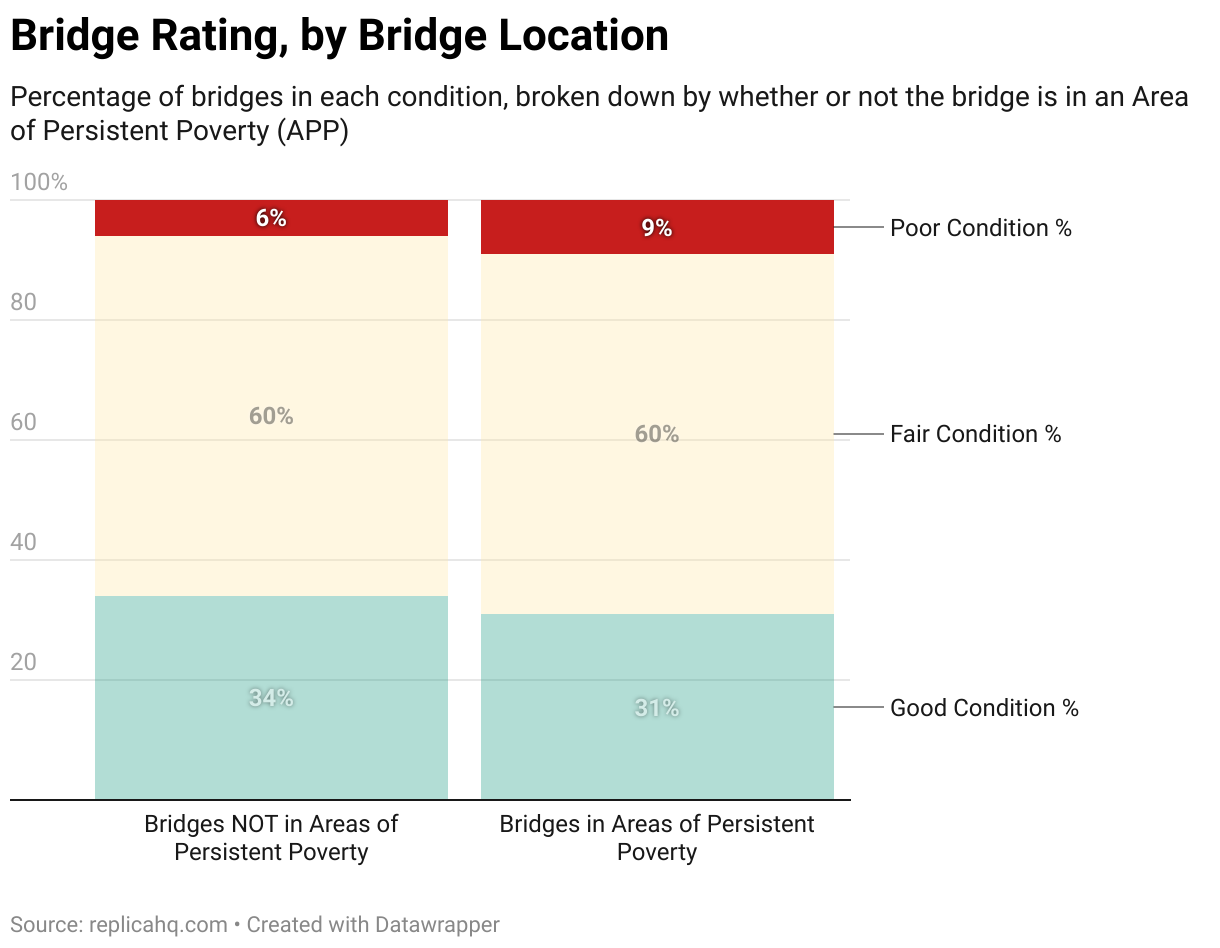
- Bridges in Areas of Persistent Poverty are 50% more likely to be categorized as having a Poor condition. Across the country, 9% of bridges located in Areas of Persistent Poverty (APP, as defined by the Bipartisan Infrastructure Law) are rated in Poor Condition, while the same is true of only 6% of bridges not located in an Area of Persistent Poverty.
- Bridges rated in Poor condition have on average roughly twice as many walking and biking trips as bridges rated in Good condition. The median number of daily walking and biking trips on bridges rated Poor in our dataset is 180, while the median number on bridges rated Good is only 95. Similarly, on average 2.5% of trips on bridges rated Poor are walking and biking trips, while only 1% are on bridges rated in Good condition.
- Traffic from households making less than twice the poverty line make up more than 25% of traffic on 670 of the 4,600 bridges in the data. Texas, Louisiana, and Mississippi each have more of these bridges than any other state. Across the country, 52 of these 670 bridges are categorized as in Poor condition in DOT’s Bridge Database.
- The most critical bridge in the country? The George Washington Bridge. No surprise there, considering it’s the most trafficked bridge in the country, and serves as a critical commute artery for the country’s largest metro. But it’s not the highest ranked bridge with a Poor rating from the USDOT. That would be a bridge on US-76 in Sumter County, South Carolina.
- Texas, Louisiana, and California have the most bridges with a Criticality score above 50. Each of those three states have more than 40 bridges with a score greater than 50. No other state has more than 31 (Arkansas). You can see the full state breakdown in the charts below.


Looking Ahead
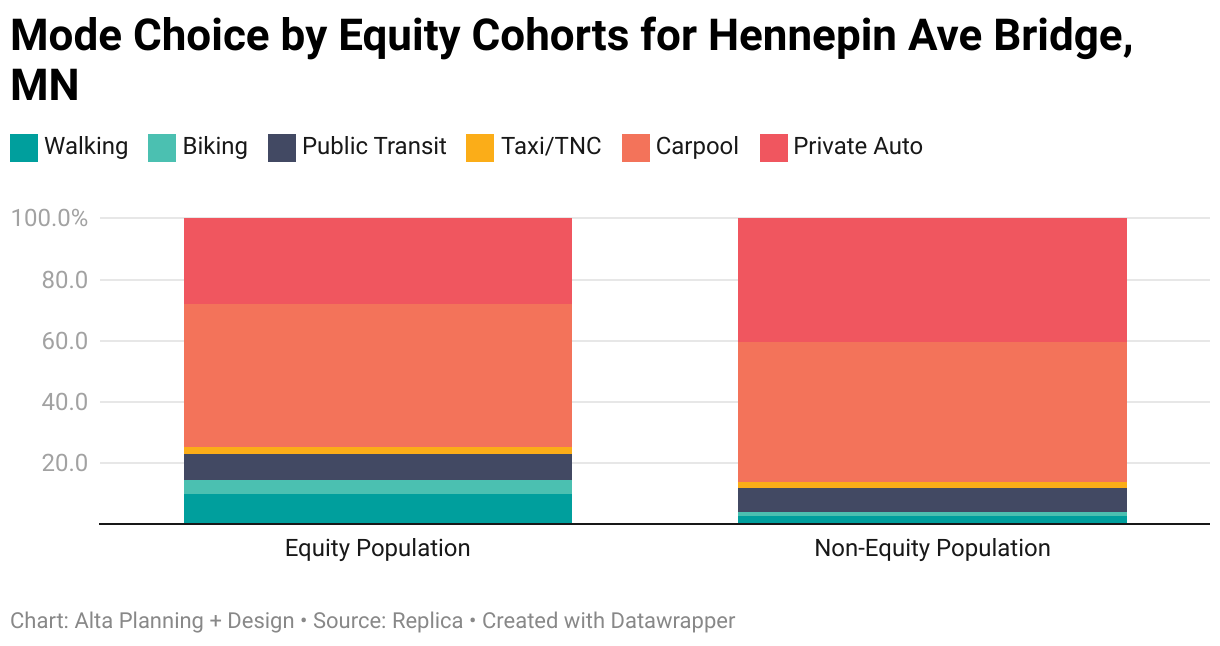
This map is the first national dataset looking at how low-income populations benefit from the use of major bridges in the United States. While the results might seem marginal on average, there are likely more stark and insightful patterns when this dataset is broken down by state, built context (urban vs. rural areas), bridge type, or specific bridges. For example, when evaluating traveler characteristics found that for high-equity scoring bridges such as the Hennepin Avenue Bridge, MN, there were slight differences in trip purpose between equity and non-equity populations, but large differences in mode choices used by each population. This dataset provides a rich illustration of how national scale and consistent model outputs can be used to ask new questions about who benefits from major investments in our region's connections.
We invite you to explore the data here to identify additional insights a dataset like this could provide.


.jpg)