Massachusetts is a statewide Replica customer. As part of a 2023 Memorandum of Agreement, MassDOT and 15 regional transportation authorities (RTAs) pledged to work together assess transit accessibility and service coverage. After assessing multiple data sources, MassDOT ultimately decided to utilize Replica to undertake this analysis. We conducted the following interview with Liz Williams, who was a leader on the project team. Our conversation, edited for length and clarity, is below.
Thanks for joining us, Liz. Can we start by having you introduce yourself and walk through your role at MassDOT?
I'm Liz Williams, the Director of Data and Policy at MassDOT’s Office and Transportation Planning. Our office is a shared service across all of the different modal divisions of MassDOT including the MBTA. We actively look for places and ways where we can be supportive of all the work that happens across the agency, whether that's with our Regional Transit Authorities (RTAs), or within our Highway Division, or with our Registry of Motor Vehicles.
Excellent. Can you talk about this new tool?
Well, when we got access to Replica data, we realized that the flows data that is included in your platform would be able to satisfy some of the requirements of a recent memorandum of agreement between our agency's Rail and Transit Division and Massachusetts’ 15 regional transit authorities. This MOA included an assessment of service coverage. The idea was that there needed to be an evaluation among the RTAs of who was being served by transit and what sort of gaps existed in current coverage.
What we ended up creating is the RTA Service Coverage Tool. It’s a resource to assist transit planners and other stakeholders to evaluate the degree of coverage provided by existing services with respect to:
- total service area;
- selected critical destinations; and
- mode-agnostic origin-destination flows.
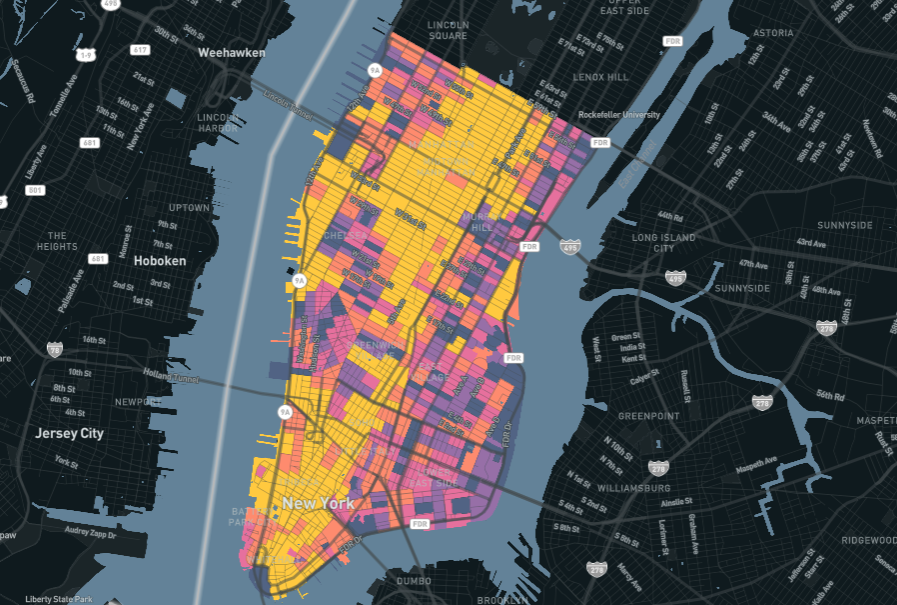
The dashboard allows users of each RTA to visualize not only the fixed bus routes (and associated walking buffers) in each service area, but also various critical destinations to see if there are gaps in coverage with respect to access to hospitals, schools, supermarkets, and other places of interest.
You can even select specific locations if there is a site specific need you’re interested in filling. The flows data represents the volume of total trips between traffic analysis zones (TAZs), inclusive of auto, transit, and other modes. This feature allows users to see the origin points of travelers going to high-demand areas, and trends in the destinations of travelers moving away from an area. When overlayed with RTA route and stop information, users are able to evaluate the degree to which services are responsive to various trip patterns.

So the MOA predates MassDOT’s subscription to Replica. How did you go about deciding what data sources to use for the analysis mandated in the agreement?
We had a different data provider under contract prior to Replica. With that provider, the tool basically didn't get off the ground because as an agency, we had some concerns with data vintage quality. So while we did want to include demand data in the original scope of work, we ultimately paused the project at the time. By then, the tool was effectively reduced to a simple visualization of critical destinations over GTFS feeds with maybe a walking buffer, which isn't really useful for anybody.
But then when we got the Replica data and we were able to get really granular trip flows, that really unlocked a lot of the potential of the tool.
Now that the data is integrated, have there been any initial success stories?
Well just last week, Lin [Liz’s colleague at MassDOT] gave an amazing presentation to the RTAs in which we included Replica’s flow data. It allowed us to identify high-demand OD patterns that didn't have corresponding transit service coverage.
One really good example is in Great Barrington, which is a city in western Massachusetts. It's a really big tourist destination, but it's also in one of the most rural parts of the Commonwealth, and so it doesn't have great transit service coverage.
With Replica data and the tool we built, we were able to identify a pretty localized trip flow that didn't have that corresponding service. I think that was really eye-opening to the administrators of that RTA.

It’s great to hear it’s already made an impact, especially in more rural places, where it’s often harder to get good data. What’s next for this tool?
We were really eager to get the first version out, which is why we focused on the critical, busiest destinations. As we expand the tool to more locations, I think there is an opportunity to add more of the granular detail that Replica offers, like trip purpose. There’s also potential for us to bring in more data about travelers. Also, right now, we are really mode agnostic, but I think users will be interested to add in mode-specific flows to understand things like where vehicle trips are being made and how those types of trips compare to transit trip flows. That would allow transit agencies to better tailor their service to capture those types of trips through unmet demand.
Those possibilities are some of the great things about Replica data. There’s so many, for lack of a better word, “attachments” to each trip. You can look at trips by purpose or by mode, or by details about the person making the trip. That’s what I’m excited to experiment with in a second iteration of the tool.
MassDOT is pretty sophisticated with its integration of data. Any pieces of advice or best practices that you would share with agencies who might be thinking, “I know I need to be using big data, but I’m not quite sure the best way to go about it.”?
What we hear a lot, and this happens often with equity data in particular, is that people are afraid of it. Because it seems too complicated and it seems scary. And so nobody wants to dive in because nobody wants to mess up. And I get it. It’s easy to be frustrated with big datasets, especially when you aren’t sure you understand what you’re looking at.
So the approach we’ve taken is to start with the big question we want to answer. Take this flow tool. Rather than trying to answer every question at once and visualize everything on a map all together so it gets overwhelming, we’ve decided to localize it at first. And we say, we’re more interested in this specific question, like what are really local flows for car trips in this one location. It's kind of low-hanging fruit. It'll make me comfortable clicking around, using the data and pulling things out. And then, you know, you can build on that.
So we’d start with just hyper local car trips, and then maybe build on it to look at the difference in flows for transit trips. And then keep on layering stuff and then all of a sudden, you've got something that is super sort of robust and thorough and useful.
So I guess my advice is always take a breath, no need to overcomplicate it, especially as you’re first trying to approach something. Instead, break things up into small chunks and look for something that's really manageable and not going to give anybody anxiety.
Do you have plans to use Replica on more projects?
So in our planning office, Replica is now our sort of go-to location-based services data set. We use it as part and parcel on all of our corridor planning studies. We have a lot of them going on right now so I won’t bore you with all of the details but it's basically how we establish existing conditions and then do alternatives evaluation, especially alongside our travel demand model that does the forecasting work.
You know, I think Replica is really powerful in helping people understand sort of what key challenges and opportunities are in any given area or part of the network.
I’m also excited about working on our statewide congestion report right now. Replica adds in context for each trip that we analyze. We have lots of sources for travel time, but the Replica data adds that trip purpose, adds that traveler info, adds that more dynamic element of why were people even going out at that time? And what were the other options that were available to them at that time? It adds a whole other layer to the story that we're trying to tell about congestion.
Well we are excited to help tell that story with you. Thanks so much for your time, Liz.


.jpg)